

What Is Social Media Analytics Unlocking Data for Smarter Marketing
Wondering what is social media analytics? This guide breaks down how to track key metrics, analyze data, and turn social insights into real business growth.
Social media analytics is the process of gathering data from your social channels to figure out what’s working, what isn’t, and—most importantly—why. It's the critical difference between throwing content at the wall to see what sticks and making smart, informed decisions that actually drive business results.
Think of it as the GPS for your marketing. Without it, you’re just driving blind. A practical example? A small e-commerce brand might use analytics to discover that their Instagram posts featuring customer photos get 50% more engagement than their professional product shots. The actionable insight is clear: shift their content strategy to prioritize user-generated content to boost community and sales.
What is Social Media Analytics, Really?
Imagine you’re a chef. You wouldn’t dream of sending a dish out of the kitchen without tasting it first, right? You need to know if it’s perfectly seasoned or a total disaster. Running a social media account without looking at your analytics is exactly like that—it’s pure guesswork.
Social media analytics is your "taste test." It's the simple practice of tracking and analyzing data from platforms like Instagram, TikTok, and LinkedIn to see how you're doing. This data gives you a window into who your audience is, how your content is performing, and what kind of impact you're really making. For a great back-to-basics explanation, this guide clearly breaks down what social media analytics is in simple terms.
It’s about moving beyond just counting likes and followers (often called vanity metrics) and connecting what you do on social media to real business goals. Analytics helps you answer the tough questions that actually push your brand forward.
Moving From Guesswork to Growth
When you don’t have data, your entire strategy is built on a foundation of assumptions and "I think this will work..." feelings. Once you bring analytics into the picture, every move you make is backed by cold, hard evidence. This shift is a game-changer for anyone—creators, brands, agencies—who wants predictable growth instead of just hoping for the next viral hit.
The market itself tells the story. The global social media analytics market was valued at around USD 10.23 billion in 2024 and is expected to explode to over USD 43 billion by 2030. Why the massive jump? Because businesses everywhere are finally realizing that understanding their customers online isn't just a nice-to-have; it's essential for survival.
Let's look at the two different mindsets side-by-side. The difference is night and day.
Marketing Approach Gut-Feeling vs Data-Driven Analytics
This table really highlights the shift from just guessing to knowing. On one side, you have the old way of doing things based on intuition. On the other, you have a modern, effective approach powered by real insights.
Aspect | Gut-Feeling Approach (The Guesswork Method) | Data-Driven Approach (The Analytics Method) |
|---|---|---|
Content Strategy | "I think our audience will like this video." | "Our data shows short-form videos with tutorials get 3x more shares, so we'll make more." |
Posting Times | "Let's post around noon, that feels right." | "Engagement peaks at 7 PM on Thursdays. We'll schedule our key posts for that window." |
Campaign Success | "We got a lot of likes, so the campaign was probably a success." | "The campaign drove a 15% increase in website clicks and generated 50 qualified leads." |
Audience Insight | "Our followers are probably young adults." | "Our primary audience is 25-34, lives in major cities, and engages most with content about sustainability." |
Ultimately, one path leads to inconsistent results and wasted effort, while the other leads to repeatable success and a much stronger return on your investment.
The Four Levels of Social Media Insight
To get real value from your social media efforts, you have to move beyond just counting likes and shares. The best way to do that is to think about analytics in four distinct levels. I like to use a doctor-patient analogy: each level asks a deeper question, turning a simple report card of data into a strategic playbook for growth. This framework helps you stop just observing what's happening and start actively shaping what happens next.
This is all about turning raw data into strategy, engagement, and ultimately, ROI.
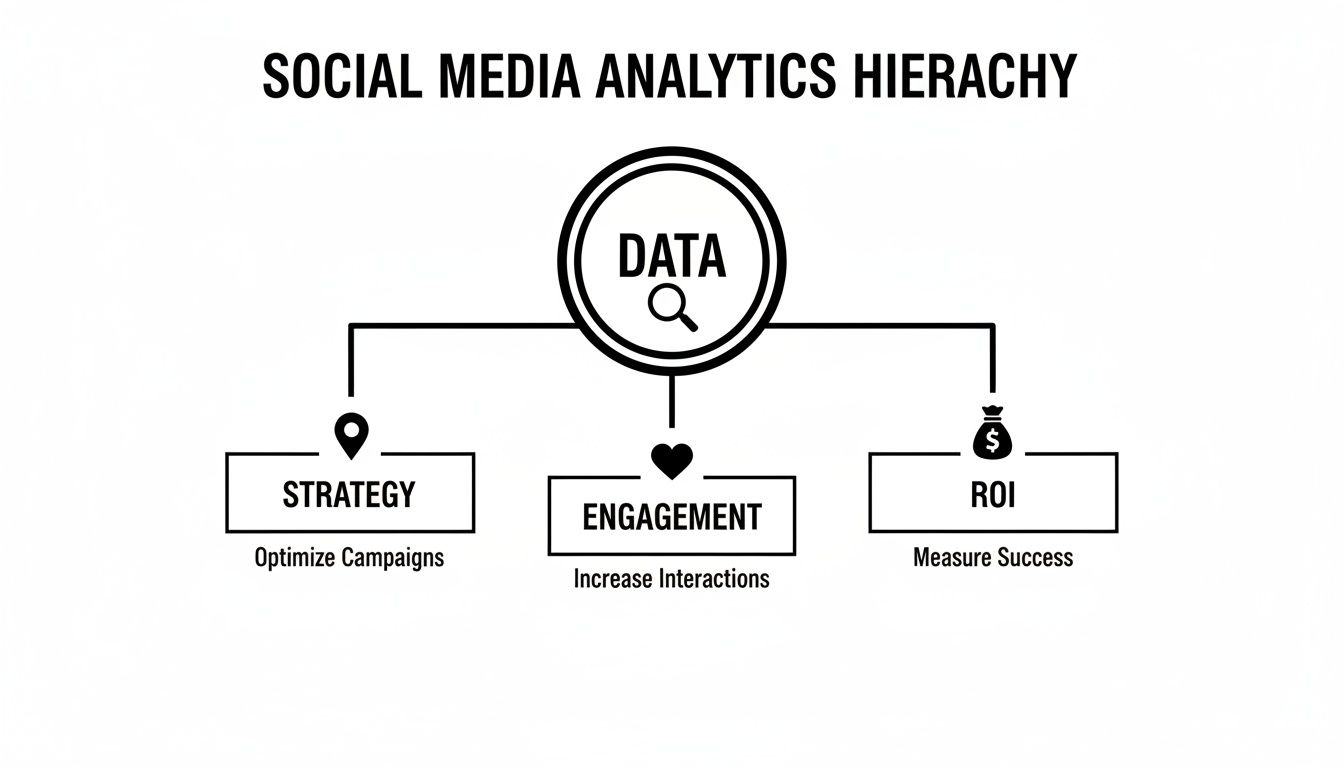
As you can see, analytics isn't a single action. It’s a process where the numbers you gather should directly inform your engagement tactics, your big-picture strategy, and your bottom line.
Level 1: Descriptive Analytics (What Happened?)
This is where everyone starts, and it's the most common form of social media analytics. Think of it as a doctor checking a patient's vital signs—temperature, blood pressure, heart rate. Descriptive analytics simply tells you what happened in the past by summarizing the data.
It answers the most basic question: "What happened?" This gives you a snapshot of your performance over a set period.
Here's what it looks like in practice:
Practical Example: A monthly report shows your Instagram post got 1,200 likes and 150 comments last Tuesday. Your follower count on TikTok grew by 5% last month, and the link in your LinkedIn article was clicked 300 times.
Actionable Insight: This level provides a baseline. While not deeply strategic, it helps you spot anomalies. If your average post gets 500 likes, that 1,200-like post is worth investigating further.
This level is crucial for day-to-day monitoring, but it won't tell you why any of this happened. It’s the foundation, and you can’t build anything without it, but the real insights are yet to come.
Level 2: Diagnostic Analytics (Why Did It Happen?)
Okay, so you know what happened. The next logical question is why. This is where diagnostic analytics comes in. Back to our doctor analogy: if the patient has a fever (the what), the doctor now looks for the root cause—maybe it's an infection (the why).
At this level, you're digging deeper to find relationships and causes. You're moving from just observing to actually investigating.
Here's the key idea: Diagnostic analytics is all about connecting the dots between your actions and your results. It helps you figure out the "secret sauce" behind your wins and what went wrong with your flops, so you can do more of what works and less of what doesn't.
Practical Example: A short-form video you posted to TikTok went viral, hitting 1 million views (the "what"). Your diagnostic analysis reveals it used a trending audio clip that peaked that exact day, and you posted it during a 7 PM engagement window you'd never tried before.
Actionable Insight: The virality wasn't random. The insight is to now test posting other videos at 7 PM and to actively monitor trending sounds to replicate this success.
Answering these "why" questions is what really helps you refine your content strategy and start making smarter decisions.
Level 3: Predictive Analytics (What Will Likely Happen?)
This is where things get really interesting. Predictive analytics takes all your historical and diagnostic data and uses it to make educated guesses about the future. It's like the doctor using a patient's history and current symptoms to predict how an illness will likely progress. This level often uses statistical models and machine learning to forecast trends and outcomes.
It answers the forward-looking question: "What is likely to happen next?" This helps you get ahead of the curve and plan your campaigns with more confidence.
Practical Example: An analytics tool analyzes your past six months of LinkedIn data and forecasts that posts containing industry statistics are 40% more likely to achieve an above-average click-through rate in the next quarter.
Actionable Insight: You can now proactively plan your content calendar to include more data-driven posts when launching your next B2B service, increasing the odds of a successful campaign.
For instance, a tool like NicheTrafficKit might analyze your past data and suggest that carousels about industry case studies are your best bet for high performance on LinkedIn next month.
Level 4: Prescriptive Analytics (What Should We Do?)
This is the holy grail—the most advanced and valuable level of social media analytics. It doesn't just tell you what's going to happen; it recommends specific actions you should take to get the outcome you want. It's the doctor not only diagnosing an illness and predicting its course but also writing a precise prescription to treat it.
Prescriptive analytics answers the ultimate question: "So what should we do about it?"
This level pulls together insights from all the previous stages to give you clear, data-backed recommendations.
Practical Example: Your tool predicts that engagement will drop by 15% next month if you continue posting only single-image graphics. It then prescribes a solution: "Increase video content by 30% and incorporate two interactive Instagram Stories polls per week to reverse this trend."
Actionable Insight: You now have a clear, specific, and measurable action plan to execute immediately, removing all guesswork from your strategy.
When you master all four of these levels, social media analytics stops being a passive reporting tool and becomes an active, strategic partner that guides every single decision you make.
Tracking Social Media Metrics That Actually Matter
Ever feel like you're drowning in data? It's a common trap. With so many numbers available, it's easy to get lost tracking things that don't move the needle. The real secret to smart social media analytics isn't about measuring everything—it's about measuring the right things.
When you focus on metrics that tie directly to your business goals, the data stops being noise and starts becoming a roadmap. Instead of just chasing vanity numbers like follower counts, let's break down the metrics into four key categories that follow the customer journey. This helps you understand not just what's happening, but why it matters.
H3: Awareness Metrics: How Many People See You?
Think of awareness metrics as the top of your funnel. They tell you how many eyeballs are on your content, measuring your potential audience size and how far your message travels.
Reach: This is the big one—the total number of unique users who saw your content. If 1,000 individual people see your post, your reach is 1,000. It’s a clean, simple measure of your audience's breadth.
Impressions: This is the total number of times your content was shown in a feed. One person could see the same post three times, which would count as three impressions but only one person reached.
Practical Takeaway: If your impressions are high but your reach is low, it means your existing followers are seeing your posts over and over. This is a clear signal to test new hashtags or collaborate with other accounts to expand your reach to a fresh audience.
H3: Engagement Metrics: Is Your Audience Connecting?
This is where the real connection happens. Engagement metrics prove that people aren't just scrolling past—they're actually interacting with what you're posting. A high engagement rate is the clearest sign that your content is resonating.
A high engagement rate is the clearest signal that you've built a genuine connection with your audience. It proves your content is not just visible, but valuable enough to inspire action.
Here are the engagement metrics to watch:
Likes, Comments, and Shares: The classic trio. Comments are gold because they take more effort than a simple like. And shares? That's a personal endorsement that expands your reach for free.
Saves: On platforms like Instagram and Pinterest, a "save" is a huge compliment. It tells you your content is so useful that someone wants to come back to it later. That's a great sign you're creating evergreen value.
Video Views and Watch Time: For video, these are everything. A short watch time on a long video is a dead giveaway that your intro isn't grabbing attention, giving you a clear target for improvement.
Practical Takeaway: If a post gets thousands of likes but almost no comments, it was likely visually appealing but not thought-provoking. Your actionable insight is to add a clear question or a call-to-action in your next caption to spark a conversation.
H3: Conversion Metrics: Are You Driving Business Results?
This is where your social media efforts hit the bottom line. Conversion metrics track how well you’re turning your audience into website visitors, leads, and paying customers.
Click-Through Rate (CTR): The percentage of people who saw your post and actually clicked the link. A strong CTR means your content and call-to-action are working together perfectly.
Cost-Per-Lead (CPL): An essential metric for paid ads. It tells you exactly how much you're spending to get one new lead, helping you manage your ad budget efficiently.
Conversion Rate: This tracks the percentage of visitors from social media who take a specific action on your site, like buying a product or signing up for your email list.
Practical Takeaway: If your Instagram Stories get a high CTR to your product page, but the conversion rate is low, the problem isn't your social media content—it's likely an issue with your landing page. The insight is to optimize the mobile checkout process or clarify the product description.
H3: Advocacy Metrics: Who's Talking About You?
Advocacy metrics zoom out beyond your own profile to measure what people are saying about your brand online. This is the modern-day version of word-of-mouth marketing.
Brand Mentions: This keeps track of every time your brand is mentioned, even if you aren't tagged. It gives you a much wider view of your brand’s reputation.
Sentiment Analysis: This is a game-changer. It analyzes brand mentions to tell you if the chatter is positive, negative, or neutral. A sudden spike in negative sentiment can be an early warning of a PR fire, giving you time to get ahead of it.
Practical Takeaway: If sentiment analysis shows a spike in negative mentions related to "shipping times," you can proactively create a social media post addressing the issue and share it with your customer service team. This turns a complaint into a transparency win.
Essential Metrics By Platform and Business Goal
To make this even more practical, let's look at which metrics matter most depending on your goal and the platform you're using. Not every metric is created equal, and your focus should shift based on what you're trying to achieve—whether that's building brand awareness or driving direct sales.
This table is a quick cheat sheet to help you zero in on the numbers that will give you the most valuable feedback for your specific strategy.
Business Goal | Key Metrics on Instagram/TikTok | Key Metrics on LinkedIn/Facebook | Key Metrics on Pinterest/YouTube |
|---|---|---|---|
Brand Awareness | Reach, Impressions, Video Views, Follower Growth Rate | Reach, Page/Profile Views, Shares, Brand Mentions | Impressions, Channel/Profile Views, Watch Time, Subscribers |
Lead Generation | Website Clicks, Story Link Taps, Bio Link Clicks, Form Fills | Link Clicks, Lead Form Completions, Website Traffic, CTR | Outbound Clicks, Website Visits from Pins/Videos |
Sales/Conversions | Product Tag Clicks, Website Conversion Rate, ROAS | Conversion Rate, Cost-Per-Acquisition (CPA), ROAS | Outbound Clicks to Product Pages, Revenue from Social, CPA |
Audience Engagement | Likes, Comments, Shares, Saves, DMs, Story Replies | Comments, Reactions, Shares, Event Responses, Group Activity | Comments, Repins/Saves, Likes, Audience Retention Rate |
By aligning the metrics you track with both your platform and your overarching business objectives, you ensure that every piece of data you collect is actionable and pushes you closer to your goals.
Choosing the Right Analytics Tools for Your Needs
When you’re just getting started, the built-in analytics on platforms like Instagram or TikTok are perfect. They give you a quick and easy snapshot of what’s happening—your likes, shares, and new followers. It's a great place to begin.
But as your brand grows, a problem starts to emerge. You find yourself drowning in a sea of open browser tabs, trying to stitch together a coherent picture of your performance from a dozen different places. It’s not just inefficient; it’s holding you back.
This is exactly when a dedicated social media analytics tool stops being a "nice-to-have" and becomes absolutely essential. Think of it like this: you've been navigating with a handful of separate, paper road maps. A proper analytics tool is like upgrading to a powerful, all-in-one GPS that shows you the entire landscape in real time, revealing the fastest and smartest routes to your destination.
Moving Beyond Native Analytics to a Unified Dashboard
The single biggest win you get from a specialized tool is pulling all your data into one, unified dashboard. This central hub saves an incredible amount of time, but more importantly, it lets you see the bigger picture. You can finally understand how your audience on Pinterest behaves differently from your followers on LinkedIn without getting lost in a mess of spreadsheets.
This move toward a single source of truth is a huge trend. In fact, platform solutions have become the dominant force in the social media analytics market, expected to capture 42% of the global market share in 2025. Businesses are clearly voting with their wallets, ditching fragmented data for integrated platforms that offer a complete view of their performance.
The Must-Have Features in Any Good Tool
Let’s be honest, not all analytics platforms are built the same. As you start looking around, you'll see a lot of options, but a few key features separate a simple reporting tool from a real strategic asset that can drive your growth.
Here’s what you should really be looking for:
Automated Reporting: The tool has to do the heavy lifting for you. It should automatically pull your data and create clean, customizable reports, freeing you from mind-numbing data entry so you can focus on what it all means.
Competitive Benchmarking: It’s not enough to know how you’re doing. A great tool shows you how you stack up against your direct competitors. This context is everything when it comes to setting realistic goals and spotting opportunities.
Sentiment Analysis: This is where things get interesting. This feature looks beyond the raw numbers to analyze the emotion behind mentions of your brand—are people happy, frustrated, or just neutral? It’s like an early warning system for your brand's reputation.
AI-Powered Insights: The best tools now use AI to find the signal in the noise. They can spot emerging trends before they blow up and identify patterns in your performance that a human eye would easily miss. It’s a serious competitive advantage.
Choosing the right tool isn’t about finding the one with the longest feature list. It’s about finding the one that clearly answers your most important business questions. Can it help you understand campaign ROI, customer behavior, or content effectiveness? That’s the real test.
For instance, if your brand is heavily invested in Reddit, a generic, all-purpose tool might not cut it. You'd need something that understands the nuances of subreddits and user interactions on that specific platform. If you're looking for detailed subreddit analysis, you might be interested in our guide on getting started with a free Reddit analytics tool.
When you match the tool to your specific goals and platforms, you transform data collection from a chore into a proactive, results-driven part of your strategy.
Turning Social Data Into an Actionable Marketing Strategy
Collecting a mountain of social media data is one thing. Actually using it is another. On its own, raw data is just a pile of numbers—it’s like having all the ingredients for a cake but no recipe. The real magic happens when you turn those numbers into clear, confident decisions that sharpen your marketing strategy every single day.
This is where you finally connect the dots between what your audience is doing and what you should do next. It’s all about creating a simple, repeatable system for making smarter choices.

Building Your Action Framework
A good framework isn’t about complicated formulas. It’s about asking the right questions and creating a straightforward "if this, then that" process. You spot a pattern in your data, figure out what it means, and then decide on a specific move to make.
This simple approach takes the guesswork out of the equation. It empowers you to make solid choices that are actually backed by real evidence from your audience.
Let's look at how this plays out in the real world.
Example Scenario 1: Figuring Out What Content Clicks
The Data (If this...): You notice your Instagram Reels that feature customer testimonials get a share rate 3x higher than your slick, product-focused videos.
The Insight: This tells you loud and clear that your audience craves authenticity. They trust real people more than a sales pitch and are more willing to share those stories. Social proof is king.
The Action (...then that): Greenlight a monthly "Customer Spotlight" series using this exact testimonial format. You’d then shift some of your video budget toward capturing more of these genuine user stories.
Setting Meaningful Benchmarks
Before you can spot a home run, you need to know what a typical base hit looks like. That’s what benchmarking is all about. It’s the process of figuring out your normal performance levels so you can immediately recognize when something is a huge success—or a total flop.
Without benchmarks, every metric is just a number floating in a void.
Get started by tracking your average performance over a 30-day period. Focus on core metrics like:
Average engagement rate per post
Average reach for different content formats (e.g., image vs. video vs. carousel)
Average click-through rate on links in your bio or stories
Once you have these baseline numbers, you have context. A post that gets double your average engagement isn’t just "good"—it’s a breadcrumb trail leading to your next big win.
Benchmarking turns raw data into a performance scorecard. It helps you define what success actually looks like for your brand, moving you beyond generic industry standards to focus on your own continuous improvement.
For instance, seeing how other brands approach their goals can be a huge help. Exploring different social media strategy examples can give you some great ideas for setting your own benchmarks and objectives.
Identifying and Acting on Patterns
With your benchmarks set, the real fun begins: pattern hunting. This is where you dig through your social media analytics to find consistent trends, outliers, and connections. The goal is to find repeatable formulas for success that you can use over and over.
Here’s how the "if this, then that" model works for different parts of your strategy:
1. Nailing Your Post Timing
The Data (If this...): Your LinkedIn analytics consistently show that audience engagement spikes between 8 AM and 10 AM on weekdays but falls off a cliff after lunch.
The Insight: Your professional audience is clearly most tuned-in when they start their workday, scrolling through industry updates before their meetings pile up.
The Action (...then that): Use a scheduler like NicheTrafficKit to line up all your most important posts—company news, thought leadership articles—to go live right in that prime 8-10 AM window.
2. Refining Your Content Mix
The Data (If this...): On Facebook, you see that posts asking a direct question get 50% more comments than posts that just make a statement.
The Insight: Your Facebook followers aren't just there to listen; they want to talk. They are eager to join a conversation and share their two cents.
The Action (...then that): Tweak your content calendar to ensure at least 40% of your Facebook posts now include a question designed to get people talking.
3. Tying Social Activity to Business Goals
The Data (If this...): You notice your Instagram Stories showing "behind-the-scenes" office life have the highest tap-forward rate to the careers page link in your bio.
The Insight: Potential hires are super interested in your company culture. It's not just a nice-to-have; it’s a major factor in their decision to apply.
The Action (...then that): Create a whole new content pillar built around employee stories and workplace culture. You could even team up with your HR department to launch a targeted recruiting campaign on Instagram using this exact content style that you know works.
This systematic process turns your social media analytics from a rearview mirror into a GPS for growth. By consistently turning observations into actions, you create a feedback loop that makes your entire marketing strategy smarter, faster, and more effective.
Common Mistakes to Avoid in Social Media Analytics
Let's be honest—just having social media analytics doesn't automatically give you an edge. Plenty of smart marketers collect mountains of data, but they often fall into a few common traps that make all that information pretty much useless.
Knowing what not to do is just as important as knowing what to do. Let's walk through the biggest mistakes I see people make and how you can steer clear of them.
Mistake 1: Chasing Vanity Metrics
This is the big one. Vanity metrics are the numbers that look great in a report but don't actually mean anything for your business goals. A post that gets 10,000 likes feels like a massive success, but if it didn’t lead to a single website click, sale, or new lead, what did it really accomplish?
Practical Example: A software company's tweet about a funny office prank goes viral and gets 50,000 likes. It feels great, but their website traffic and demo requests remain flat. The likes were a vanity metric. A less popular post about a new feature that drove 200 clicks to their pricing page was far more valuable. Actionable Insight: Focus on metrics that directly track progress toward your goals. If your goal is lead generation, your primary metric should be link clicks or form fills, not likes.
Mistake 2: Analyzing Data in a Vacuum
Another classic mistake is looking at your numbers without any context. You see a sudden 20% drop in reach and panic sets in. But what if you zoomed out and realized a major competitor launched a massive viral campaign that same week, sucking all the air out of the room?
Without context, data doesn't just lack meaning—it can be downright misleading.
The key is to treat your analytics not just as a report card for your own efforts, but as a window into the entire market conversation. Always ask "what else was happening when this data was recorded?"
Practical Example: Your Facebook reach drops by 30% in October. Instead of blaming your content, you look at the calendar and realize it's the run-up to a major election, and ad costs and competition for attention are sky-high. Actionable Insight: Before making drastic changes, always cross-reference your performance with competitor activity, industry trends (like holidays or major events), and platform algorithm updates.
Mistake 3: Disconnecting Social KPIs from Business Goals
This is probably the most critical mistake of all: treating social media as its own little island, completely separate from the rest of the business. If your company's main goal is to improve customer retention, then your social media KPIs should be things like customer service response times and positive sentiment—not just follower growth.
Practical Example: A company's main Q4 goal is to reduce customer churn. The social media team, however, is only measured on follower growth. They spend their time on viral stunts instead of monitoring for customer complaints and providing fast support. They hit their follower goal, but the company misses its churn target. Actionable Insight: Always start with the business objective, then choose social media KPIs that directly support it. For reducing churn, focus on metrics like response time, resolution rate, and customer satisfaction scores from social interactions.
Frequently Asked Questions About Social Media Analytics
Even with the best plan in place, you're bound to run into questions once you start digging into your social media data. Let's tackle some of the most common hurdles you'll face on the ground.
How Often Should I Be Checking My Analytics?
There’s no one-size-fits-all answer here, but a layered approach is usually the most effective. Think of it like checking the weather.
A quick daily check-in, maybe for 15-20 minutes over your morning coffee, is perfect for spotting any immediate fires or catching a wave of unexpected engagement. It’s your chance to see what’s happening in real-time.
Then, set aside a bit more time for a weekly review. This is where you look back at what you posted, see what resonated, and make small tweaks to your content plan for the week ahead.
Finally, your deep-dive monthly report is for the big picture. This is when you step back and measure your performance against your actual business goals, helping you map out your strategy for the next month.
What Should I Do If My Numbers Suddenly Tank?
Seeing a sudden nosedive in your metrics is never fun, but the first rule is: don't panic. Before you scrap your entire strategy, you need to play detective and figure out the context.
A dip in performance doesn't automatically mean your strategy failed. More often than not, it's a signal to look at what's happening around you. Things like a competitor's big launch, a platform update, or even a holiday can throw your numbers for a loop.
Actionable Steps:
Check Competitors: Did a rival launch a massive campaign or have a video go viral? Their success can temporarily siphon off attention.
Look at External Events: Was there a major holiday, news event, or a big game? These always disrupt normal online habits.
Investigate Algorithm Changes: Do a quick search on industry blogs or Twitter. If a platform pushed an update, other creators will be talking about it.
Understanding the "why" is always the first step. This diagnosis will tell you if you need to pivot or just ride it out. This whole process is really at the heart of what social media analytics is all about—it's not just about the numbers, but the story they tell.
Ready to stop guessing and start growing? NicheTrafficKit's AI-powered dashboard unifies your analytics, automates reporting, and delivers actionable insights so you can make smarter decisions faster. Start your free trial today and see the difference.
