How to Measure Social Media ROI Beyond Likes and Shares

Tired of vanity metrics? Learn how to measure social media ROI with proven formulas, actionable tracking methods, and real-world examples to prove its value.
Measuring social media ROI is all about connecting the dots between what you spend on social—your time, your ad budget, your tools—and the actual revenue it brings in. It's the process of moving beyond vanity metrics like likes and shares to prove that your efforts are directly fueling business growth.
Essentially, you're making sure every dollar you put in generates a real, tangible return.
Laying the Groundwork for ROI Measurement
Before you can even think about plugging numbers into a formula, you have to define what success actually looks like for your business. So many marketers get lost in a sea of data, tracking things like follower counts simply because they haven't tied their social media activity to cold, hard business goals.
The real aim here is to draw a straight line from a tweet, a pin, or a TikTok video all the way to a financial outcome. Getting this right ensures your ROI calculations are not just accurate, but actually mean something to your team and the people holding the purse strings. A vague goal like "increase brand awareness" is a dead end for ROI measurement; you need to translate it into something you can count.
Turning Broad Goals into Sharp KPIs
Your first move is to transform those big-picture business goals into specific social media Key Performance Indicators (KPIs). A KPI is just a measurable value that shows you how well you’re hitting your main objectives. This is where the fuzzy concept of "value" gets turned into a number you can actually track.
This table shows how to translate common business goals into KPIs you can measure on social media.
Translating Business Objectives into Social Media KPIs
Business Objective | Relevant Social Media KPI | Example Metric |
|---|---|---|
Increase Sales | Conversion Rate from Social | Number of sales from UTM-tagged links in social posts |
Generate Leads | Cost Per Lead (CPL) | Total ad spend on LinkedIn divided by form submissions |
Improve Customer Retention | Customer Lifetime Value (CLV) | Average CLV of customers acquired via social channels |
Boost Brand Awareness | Share of Voice (SOV) | Your brand mentions vs. competitor mentions online |
Drive Website Traffic | Click-Through Rate (CTR) | Clicks on a link in an Instagram Story vs. total views |
Think of it like this: the business objective is your destination, and the KPI is the speedometer telling you how fast you're getting there.
This initial translation is, without a doubt, the most important part of the process. If you skip this, you’re just collecting data for the sake of it. The diagram below illustrates this simple but powerful flow from your high-level objectives down to the specific metrics you'll watch.
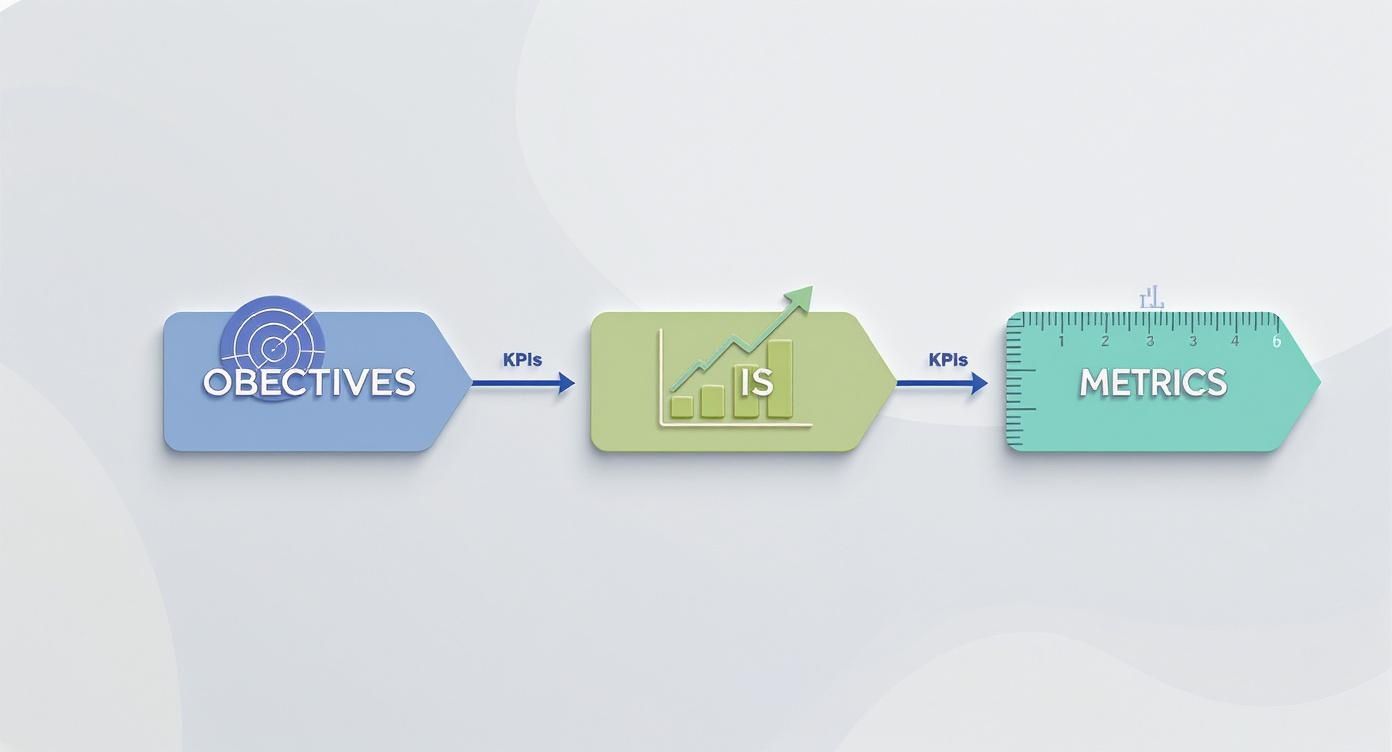
Following this model keeps your reporting focused and impactful, ensuring every metric you track serves a real purpose.
Pinpointing the Metrics That Actually Matter
Once you've set your KPIs, you can then pick the specific metrics that feed into them. For an e-commerce brand trying to boost sales, this might mean tracking every click on a "Shop Now" button. For a B2B company, it could be the number of downloads for a whitepaper you shared on LinkedIn. The crucial part is that each metric you choose represents a meaningful step on the customer's journey.
Actionable Insight: Instead of just tracking overall website traffic from social media, track the conversion rate of that traffic. Use your analytics to see what percentage of visitors from your Instagram bio link actually sign up for your newsletter or make a purchase. This is a much stronger indicator of ROI than just raw visitor numbers.
This isn't just a nice-to-have; it's a top priority for marketing leaders. One recent study found that 65% of marketing leaders are focused on directly connecting their social campaigns to business outcomes. Interestingly, for B2B marketers, 22% see Facebook as the top channel for ROI, with Instagram, TikTok, and YouTube right behind.
My Two Cents: Don't measure everything. Just measure what matters. A dashboard crammed with 50 metrics is usually less helpful than one with five that are directly tied to revenue. Always choose clarity over complexity.
Your ultimate goal is to build a measurement framework that you can use over and over again. By defining your objectives and KPIs from the start, you create a solid foundation that makes every other step—from tracking to calculation—far more straightforward and accurate.
If you want to make this even easier, you might find some of our social media marketing tools helpful for automating data collection and reporting.
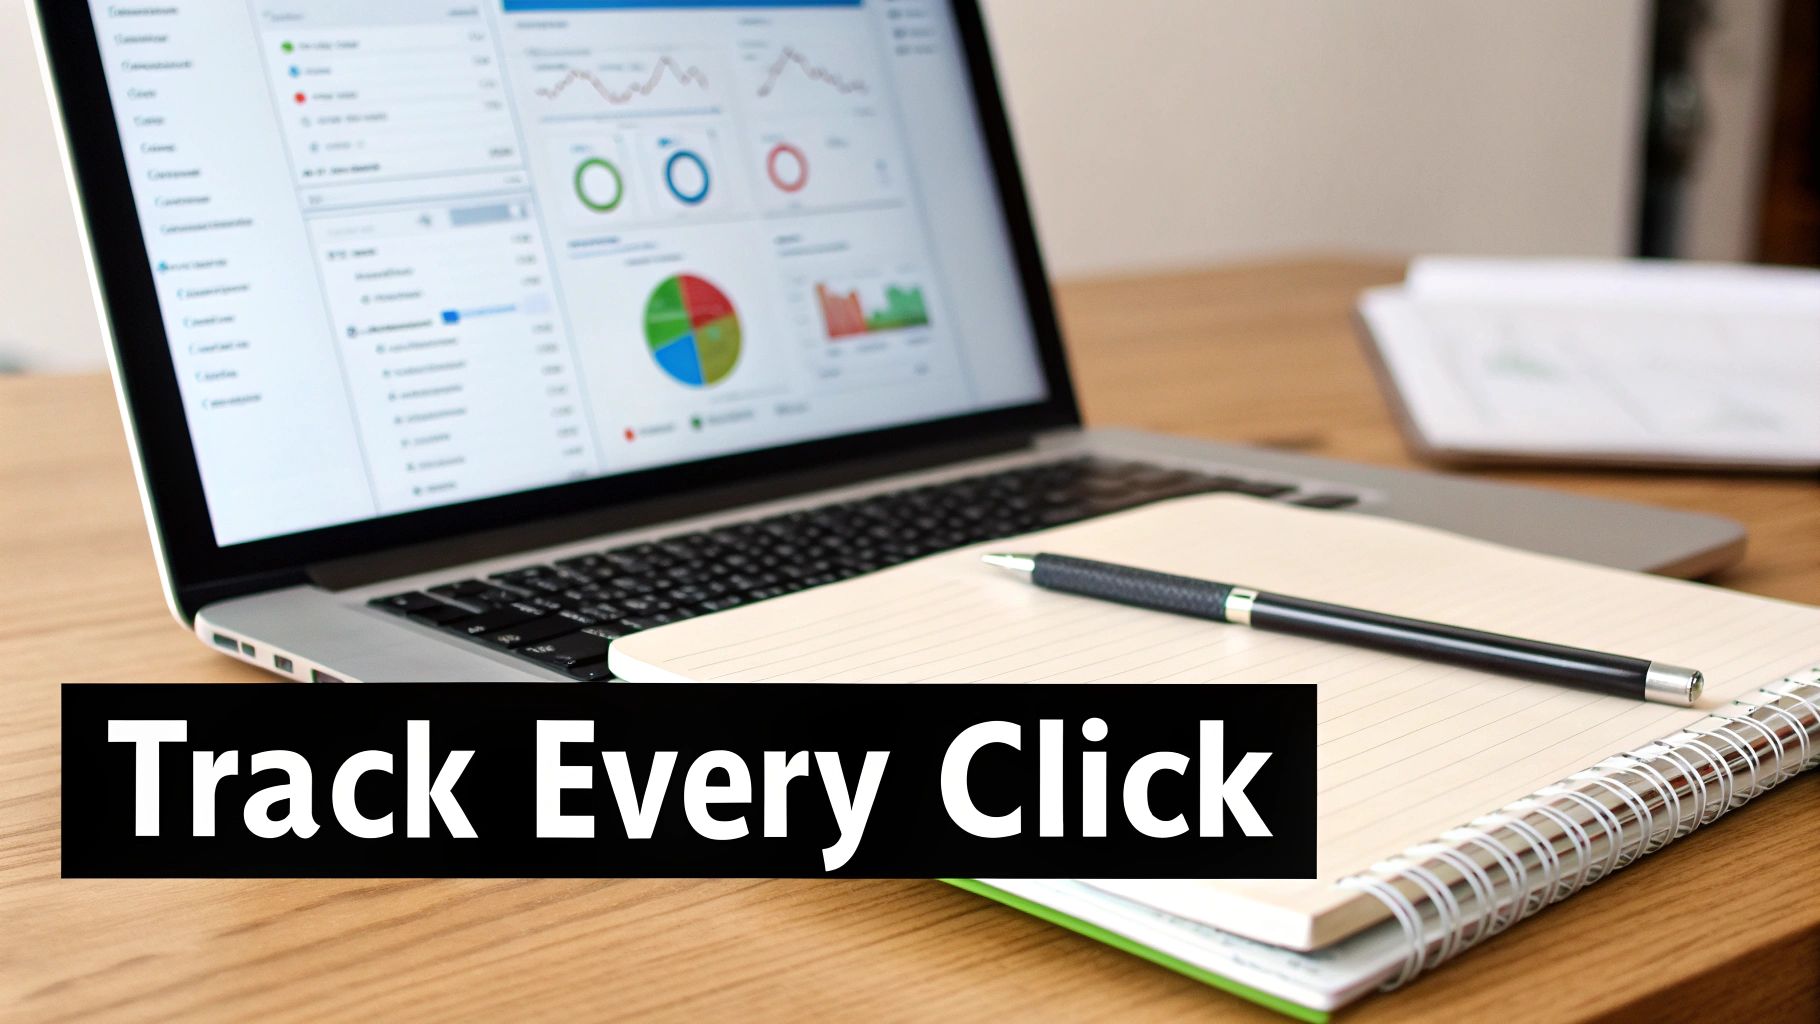
Building a Rock-Solid Social Media Tracking System
If you're going to measure ROI accurately, you can't rely on guesswork. It all comes down to clean, reliable data. Before you even think about analyzing a single metric, you absolutely need a system that captures every click, action, and conversion from your social media efforts.
This is your tracking infrastructure. It’s the technical backbone that makes proving the value of your work possible.
Without it, you're flying blind. You have no real way to connect that killer Instagram story or that high-performing LinkedIn ad to an actual sale on your website. Let’s walk through setting up the essential tools for a bulletproof tracking system.
Tracing Every Click with UTM Parameters
First things first: you need to get comfortable with Urchin Tracking Module (UTM) parameters. Don’t let the name intimidate you. They're just simple snippets of text you add to the end of a URL that tell your analytics tools exactly where a visitor came from.
Think of them as digital breadcrumbs leading right back to a specific social media post.
A properly built UTM link can tell you a ton about your traffic:
Source (
utm_source): Which platform sent the visitor? (e.g.,facebook,linkedin,tiktok)Medium (
utm_medium): How did they get here? Was it a paid ad or an organic post? (e.g.,social,cpc,influencer)Campaign (
utm_campaign): What specific marketing push is this link tied to? (e.g.,q4_sale,webinar_promo)
So, if you were promoting a new product on your Facebook page, your link might look like this: yourwebsite.com/product?utm_source=facebook&utm_medium=social&utm_campaign=product_launch
When someone clicks that link, Google Analytics (or whatever tool you use) immediately knows that visitor came from your "product_launch" campaign on Facebook. This simple tagging strategy is the absolute foundation for figuring out how to measure social media ROI correctly.
Pro Tip: Consistency is everything here. I’ve seen so many messy analytics accounts because one person uses "Facebook," another uses "facebook," and a third uses "FB." Create a shared spreadsheet or use a UTM builder tool to document your naming conventions from day one. It will save you massive headaches later.
Installing Tracking Pixels for Deeper Insights
While UTMs tell you where people came from, tracking pixels tell you what they do once they're on your website. These are little snippets of code you install on your site that talk back to the social media platforms. The most common ones you'll run into are the Meta Pixel (for Facebook and Instagram) and the TikTok Pixel.
These pixels are non-negotiable for tracking conversions that happen after the click. For example, a user sees your ad on Instagram, clicks through, and makes a purchase. The Meta Pixel fires and tells your ad dashboard, "Hey, we got a sale from that ad!"
Actionable Insight: Go install the Meta Pixel right now. Then, create a custom conversion for a key action on your site, like "Newsletter Signup" or "Add to Cart." This immediately lets you run ad campaigns optimized not just for clicks, but for the specific actions that actually grow your business.
With pixels in place, you can:
Measure direct conversions: See exactly how many sales, sign-ups, or downloads your social ads are generating.
Optimize your ad campaigns: The platforms use this data to find more people who are likely to take the action you care about.
Build powerful retargeting audiences: You can create custom audiences of people who visited a specific page or added an item to their cart and then serve them highly relevant follow-up ads.
If you’re looking to connect the dots between your different marketing tools and automate some of this data flow, check out these ZapLinker integrations.
Leveraging Native Platform Analytics
Finally, don't sleep on the goldmine of data available right inside each social media platform. The native analytics dashboards—like LinkedIn Analytics, Instagram Insights, and Pinterest Analytics—give you performance data you can’t get anywhere else.
Practical Example: On Instagram Insights, look at your "Top Posts" sorted by "Reach." Do you see a pattern? Maybe Reels with a certain audio track consistently perform better. This isn't an ROI metric on its own, but it's a powerful, actionable insight that tells you what content to create more of to drive better results down the line.
These are your best source for on-platform metrics: reach, engagement rate, video views, follower growth, and audience demographics. While these aren’t direct ROI figures, they are crucial leading indicators. They tell you how your audience is behaving and how your content is performing, which ultimately impacts your bottom line.
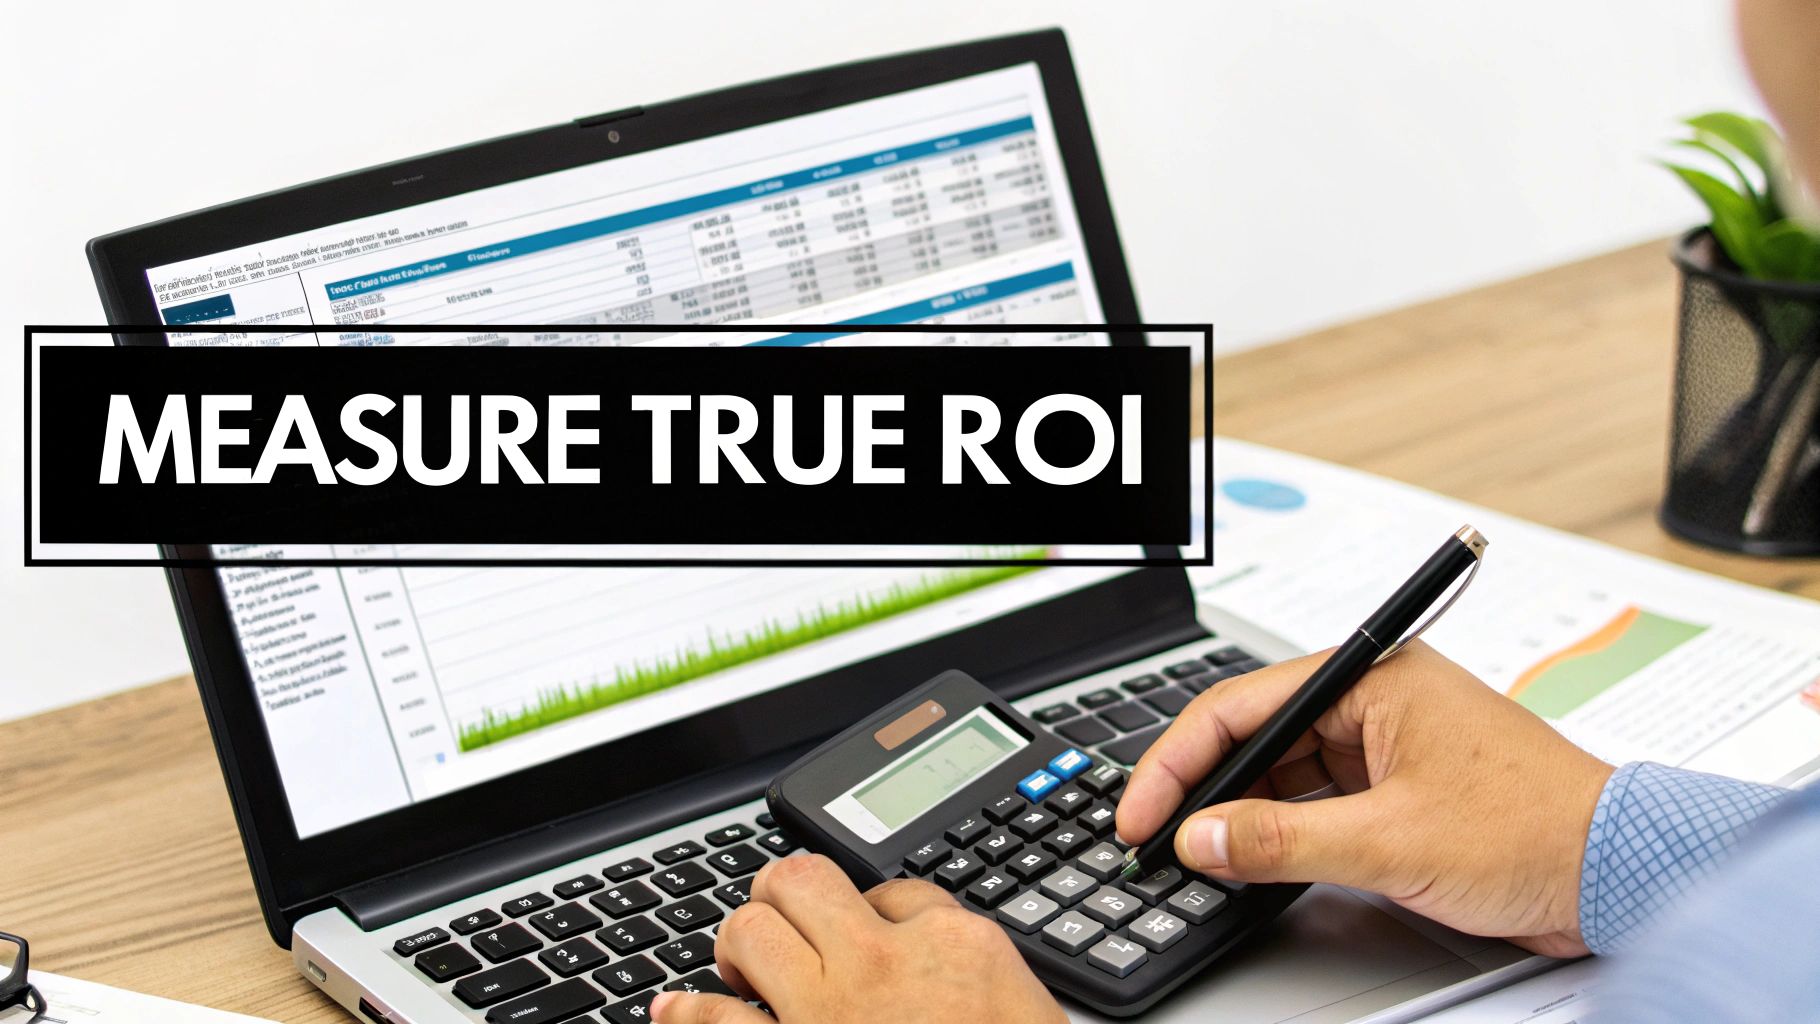
Calculating Social Media ROI with Real-World Formulas
You’ve done the hard work of setting up your tracking infrastructure. Now it’s time for the payoff: turning all that clean data into dollars and cents. This is the moment you directly connect your social media efforts to the company's bottom line.
Don't worry, you don't need a finance degree to do this. At its core, calculating ROI is about answering one simple question: "For every dollar we put into social media, how many dollars did we get back?"
The Classic ROI Formula
The standard way to measure ROI is a straightforward formula that calculates net return as a percentage. It's a classic for a reason—it’s simple and powerful.
The formula is: ROI (%) = [(Total Social Media Revenue – Total Social Media Costs) / Total Social Media Costs] × 100.
If that looks a little intimidating, think of it this way: you subtract your costs from your revenue to find your profit, then divide that profit by what you spent to see how efficient your investment was. For instance, if a campaign generates $10,000 in revenue from $3,000 spent, the ROI is a very healthy 233%. To dive deeper into the mechanics, there are some great guides on how to calculate ROI that can help prove your investment's value.
Let's walk through a tangible example.
Scenario: An E-commerce Flash Sale
Imagine an online clothing boutique runs a 48-hour flash sale, promoted exclusively through Instagram and Facebook ads.
Total Revenue Generated: Using their UTM-tagged links and the Meta Pixel, they can see exactly $12,000 in direct sales came from the campaign.
Total Costs: This is more than just ad spend. It includes $2,500 for the ads, $500 for the graphic designer who created the visuals, and an estimated $300 for the social media manager's time. That brings the total cost to $3,300.
Now, we just plug those numbers into the formula: [($12,000 Revenue - $3,300 Costs) / $3,300 Costs] x 100 = 263.6% ROI
A 263.6% ROI means that for every single dollar the boutique invested in this campaign, they generated $2.64 in pure profit. That's the kind of clear, compelling number that gets budgets approved.
Assigning Value to Non-Purchase Conversions
Okay, but what if your goal isn't direct sales? This is a common situation for B2B and service-based businesses that use social media for lead generation. You can still calculate a powerful ROI; you just have to assign a monetary value to actions like a demo request or a whitepaper download.
To do this, you'll need two crucial business metrics:
Customer Lifetime Value (CLV): The total profit you expect to make from an average customer over their entire relationship with you.
Lead-to-Customer Rate: The percentage of leads that actually convert into paying customers.
With these figures, you can calculate the average value of a single lead. For example, if your average CLV is $5,000 and your lead-to-customer rate is 10%, then each new lead is worth $500 to your business ($5,000 x 0.10).
Let's see this in action. A SaaS company runs a LinkedIn campaign to promote a webinar, hoping to get demo requests. They spend $4,000 on ads and staff time, and the campaign brings in 30 demo requests.
With each lead valued at $500, the total value generated is $15,000 (30 leads x $500). Their ROI would be a fantastic 275%. This method allows you to prove financial impact even when a credit card isn't swiped immediately.
To show how this plays out across different scenarios, here’s a table with a few examples.
Example Social Media ROI Calculation Scenarios
Campaign Type | Revenue Generated | Total Costs | Calculated ROI (%) |
|---|---|---|---|
Influencer Marketing (Product Launch) | $25,000 | $8,000 | 212.5% |
B2B Lead Gen (LinkedIn Webinar) | $15,000 (Lead Value) | $4,000 | 275% |
E-commerce Flash Sale (Instagram Ads) | $12,000 | $3,300 | 263.6% |
Organic Community Building (Reddit) | $2,000 | $500 | 300% |
As you can see, the formula works whether you're tracking direct sales from an influencer or assigning value to leads from a professional networking site.
Looking Beyond the Basic Formula
While the standard ROI formula is your North Star, digging into supporting metrics gives you the full story. One of the most important is your Customer Acquisition Cost (CAC) from social media, which tells you exactly how much you're spending to get a new customer through that channel.
In our flash sale example, the campaign brought in 60 new customers at a cost of $3,300. That means their CAC for that specific campaign was $55 per customer.
The real magic happens when you compare your CAC to your Customer Lifetime Value (CLV). If your CAC is $55 and your average CLV is $300, your social media efforts are incredibly healthy and sustainable. This comparison proves you aren't just making one-off sales; you're building a profitable customer base for the long term.
Drilling down into platform-specific data can also uncover hidden gems. For niche communities, using a free Reddit analytics tool can provide insights into user behavior that contribute to your larger business goals.
Choosing an Attribution Model That Fits Your Business
Let’s be honest: customers almost never see one post, click it, and immediately buy. Their path to purchase is usually a winding road with multiple stops across different channels. This is where marketing attribution comes in—it’s the art and science of figuring out which marketing efforts deserve credit for a conversion, and it's a non-negotiable part of accurately measuring social media ROI.
Picking the right attribution model is like choosing the right lens for a camera. The wrong one gives you a blurry, distorted picture of what’s actually working. The right one brings your customer's journey into sharp focus, ensuring you give credit where it's truly due. Without a clear model, you might accidentally slash the budget for a channel that’s quietly doing all the heavy lifting.
Single-Touch Attribution Models
The simplest approach is a single-touch model. These models give 100% of the credit for a sale to a single touchpoint. They're easy to set up, but that simplicity is also their biggest flaw.
First-Touch Attribution: This model gives all the credit to the very first interaction a customer had with your brand. It’s perfect for figuring out which channels are your best lead generators and awareness-builders.
Last-Touch Attribution: The opposite of first-touch, this model gives all the credit to the final interaction before the conversion. It’s great for identifying which channels are your best closers.
Imagine a user stumbles upon your brand through a TikTok video (first touch). A week later, they see a retargeting ad on Facebook, and then they finally click a Google search ad to make a purchase (last touch).
With first-touch attribution, TikTok gets 100% of the credit. With last-touch, Google search gets 100%. Both models completely ignore the crucial role that Facebook ad played in keeping your brand top-of-mind.
Key Takeaway: Single-touch models are straightforward but can be dangerously misleading. A B2B company trying to grow its audience might lean on a first-touch model to value its LinkedIn content, while an e-commerce brand running a flash sale will probably prefer a last-touch model to measure the impact of its final "buy now" ads.
Multi-Touch Attribution Models
For most businesses, especially those with longer sales cycles, multi-touch attribution provides a much more realistic view. These models spread the credit across multiple touchpoints, acknowledging that it often takes a village of marketing efforts to raise a customer.
This approach stops you from making the classic mistake of cutting the budget for a channel that plays a vital "assisting" role just because it doesn't usually land the final click.
Common Multi-Touch Models Include:
Linear: This model is the diplomat—it gives equal credit to every single touchpoint along the customer's path. It’s fair, but it might not properly weigh the most influential interactions.
Time-Decay: This model gives more credit to the touchpoints that happened closer to the conversion. The logic is that the interactions right before a purchase are probably more influential.
U-Shaped (Position-Based): This is a popular one. It typically gives 40% of the credit to the first touch, 40% to the last touch, and splits the remaining 20% among all the interactions in between.
Matching the Model to Your Business
So, how do you pick one? The best attribution model for you depends entirely on your business goals and how your customers typically behave.
Think about a B2B SaaS company with a six-month sales cycle. A future customer might first download a whitepaper from a LinkedIn post, later attend a webinar promoted on Facebook, engage with a few email newsletters, and finally book a demo by visiting your site directly. Here, a U-shaped or time-decay model would make a lot of sense, properly valuing both the initial lead generation and the final closing touchpoints.
On the other hand, an e-commerce brand that thrives on impulse buys from Instagram Story ads might find that a last-touch model is all they need. Their customer journey is short and sweet, so the final click really is the most important action. The goal is to find a model that mirrors the reality of your customer’s journey, giving you the clearest possible picture of your marketing performance.
Measuring the True Impact of Influencer Marketing
https://www.youtube.com/embed/cdTBXulrKNc
Trying to pin down the real return on your influencer partnerships can feel like a guessing game. Did that collaboration with a TikTok creator actually move the needle? Or was it just a shot in the dark?
The secret is to build a solid measurement plan that tracks not only the hard sales but also the softer, equally important, value of brand exposure.
Without a system, you're essentially just paying for posts and crossing your fingers. But with one, you can spot your best-performing partners, make smarter decisions for your next campaign, and ensure every dollar you spend is actually driving growth.
Tracking Direct Sales and Conversions
The most direct line you can draw between an influencer and your revenue is by tracking sales. This cuts through the noise and tells you exactly how much money a specific collaboration brought in. It’s the cleanest attribution you can get.
A few simple but powerful tactics will get you there:
Unique Discount Codes: Give each influencer their own custom discount code, something like "CHLOE15". When a customer uses that code at checkout, you know exactly who to thank for the sale.
Affiliate Links with UTMs: Arm your influencers with unique, UTM-tagged affiliate links. These track every single click and, more importantly, attribute any purchases made during that visit directly to their efforts. You'll see exactly how much traffic and revenue they're generating.
Practical Example: A skincare brand launches a new serum. They team up with an Instagram creator, giving her the affiliate link brand.com/product?utm_source=instagram&utm_medium=influencer&utm_campaign=sarah_launch and the discount code "SARAH15". By monitoring sales from both sources, the brand can calculate a precise ROI for that specific partnership. If Sarah's code and link generated $5,000 in sales and her fee was $1,000, that's a 400% ROI.
Quantifying Brand Exposure with EMV
Not every win from an influencer campaign shows up as a direct sale. A huge piece of the puzzle is the exposure and street cred they build for your brand. This is where Earned Media Value (EMV) comes into the picture.
EMV is a way to put a dollar figure on all the engagement an influencer campaign creates—the likes, comments, shares, and views. Just think of it as what you would have paid in traditional advertising to get that same level of attention and interaction.
While EMV isn't a perfect science, it gives you a consistent way to measure the brand-building side of your campaigns. It helps you compare the impact of different influencers, even if one drives fewer direct sales but generates a massive amount of buzz.
Actionable Insight: Use a simple formula to estimate EMV. Assign a value to each engagement—say, $0.10 per like, $0.50 per comment, and $1.00 per share. If an influencer's post gets 10,000 likes, 500 comments, and 100 shares, your estimated EMV is $1,350. This gives you a tangible metric to compare against their fee.
The power of influencer marketing is hard to ignore. Recent studies show it delivers an average ROI of $5.78 for every $1 spent—a number that leaves many traditional digital ad channels in the dust.
To get these kinds of numbers right, the pros rely on automated data tools to pull metrics from places like Instagram, TikTok, Google Analytics, and their sales platforms all into one cohesive dashboard. You can discover more insights about how data automation is shaping influencer marketing budgets.
If you really want to get a handle on the performance of your collaborations, using the best influencer analytics tools is a game-changer. These platforms automate the heavy lifting of tracking both sales and EMV, giving you a single source of truth that makes optimizing your strategy a whole lot easier.
Common Questions (and Clear Answers) About Social Media ROI
Even with a perfect plan in place, trying to measure social media ROI can feel like navigating a maze. I’ve seen marketers get stuck on the same questions time and time again when trying to connect what they do on social media to what happens on the bottom line. Let's clear up some of that confusion.
Think of this as your troubleshooting guide. We'll tackle the most common hurdles so you can refine your strategy and report your results with confidence.
How Can I Possibly Measure ROI for Organic Social Media?
This one comes up all the time. Measuring the return on your organic social posts feels fuzzy because you aren't spending money on ads for them. But it’s absolutely doable. The trick is to stop thinking about ad spend and start thinking about the resources you're investing instead.
First, you need to tally up your costs. This isn't just about money; it's also about time. Be sure to include:
Your team's time: What portion of your social media manager's salary goes into creating and managing organic content? Example: If your manager earns $60,000/year and spends 50% of their time on organic social, that's a $30,000 annual cost.
Your tools: Add up the monthly costs for your scheduling software, design tools like Canva, and any special analytics platforms you use.
Content expenses: Did you pay for a photoshoot, a video editor, or a freelance copywriter? Factor that in.
With your costs figured out, you can track the value you’re generating. This is where those UTM-tagged links in your bio and posts become your best friend. They let you trace website traffic and, more importantly, conversions right back to your organic efforts. If someone clicks a link in an organic Instagram story and makes a $150 purchase, that’s $150 in revenue you can confidently tie back to that post. Compare that revenue to your investment, and you've got a clear ROI for your organic strategy.
What’s a Good Social Media ROI Benchmark, Anyway?
Ah, the million-dollar question. I'll give you the honest, experienced answer: it depends. There's no magic number that works for every single business. What's considered "good" is completely tied to your industry, your profit margins, and what you’re trying to achieve.
For instance, a software company with high margins might be ecstatic with a 300% ROI (a 3:1 return). But an e-commerce store with tight margins might need to see a 1000% ROI (10:1) just to be profitable after you account for the cost of their products.
The only benchmark that truly matters is your own, period. Your goal should always be to improve on your past performance. If you hit a 250% ROI last quarter and managed to get it to 300% this quarter, that’s a huge win. It shows your strategy is working and your optimizations are paying off.
How Do I Measure Value That Isn't a Direct Sale?
So much of what social media does for a brand isn't about an immediate sale. It’s about building awareness, earning loyalty, and creating positive sentiment. These things are incredibly valuable, but you can't just slap a price tag on them, right? Well, actually, you can.
One of the most effective ways is to figure out what a lead is worth to you. As we talked about earlier, if you know your Customer Lifetime Value (CLV) and your average lead-to-customer conversion rate, you can assign a real dollar value to every email signup or demo request that comes from your social channels.
You can also look at it from a cost-savings perspective. Let's say your team is active on Twitter, handling customer support questions. You can calculate the cost of resolving an issue there and compare it to how much it would cost through a traditional call center. According to a study by Aberdeen Group, companies that use social media for customer service see a 7.5% year-over-year jump in customer retention—and keeping customers is always cheaper than finding new ones.
Which Attribution Model Is the Best One to Use?
This is less about finding the "best" model and more about finding the model that best matches how your customers actually behave. There's no one-size-fits-all answer here.
If you have a short sales cycle: Think of an e-commerce brand selling a trendy product. People see it, they want it, they buy it. In this case, a Last-Touch attribution model often makes the most sense because that final click was clearly the most influential.
If you have a long sales cycle: Now, think of a B2B company selling complex software. A customer might see a blog post, then a LinkedIn ad, then attend a webinar over several months before finally requesting a demo. Here, a Multi-Touch model (like Linear, Time-Decay, or U-Shaped) gives you a much more realistic picture by giving credit to all the different touchpoints that nurtured that lead along the way.
My advice? Start simple. Use a Last-Touch model to get a solid baseline. Once you’re comfortable and have more data, you can start exploring the more advanced multi-touch models in Google Analytics 4 to really understand how all your marketing channels are working together.
Ready to stop guessing and start measuring? NicheTrafficKit's built-in analytics dashboard unifies your data from every platform, making it easy to track the metrics that matter and prove your social media ROI. Ditch the spreadsheets and start making data-driven decisions that fuel real growth. Start your free trial and see the difference today!
